Blog
Get Pay Right on ADP Workforce Now® Next Gen™
Bringing trusted compensation intelligence and seamless planning to even more ADP users.
Written by Salary.com Staff
July 17, 2026

Earnings per share remains a vital indicator of a company's financial performance. Every HR professional based within the United States should be aware of this statistic and its implications for organizational goals.
This figure shows how much profit is created for each share of common stock the company possesses. Such information enables effective creation of incentive programs as well as communications with company leadership about equity awards.
EPS sits as perhaps the most referenced financial metric throughout corporate America. The measurement determines how much profit is generated for each share of common stock that a company features. This metric has major implications for HR professionals especially regarding executive pay, equity plans and bonuses at public companies.
| Term | Definition |
|---|---|
| Net income | The total profit a company generates after all expenses are deducted. |
| Preferred dividends | The amount paid to preferred shareholders before common shareholders receive earnings. |
| Outstanding shares | The total number of common shares owned by all shareholders. |
| Weighted average shares | The average number of shares outstanding over a period, taking into account new share issuances or stock buybacks. |
| Dilutive securities | Instruments such as stock options, convertible debt, and restricted stock units that can increase a company's share count. |
The statistic makes for one of the most prominent figures in every company's income statement as part of both its quarterly and annual reports. Publicly traded entities must reveal both basic and diluted EPS within their 10-K and 10-Q filings.
EPS is also critical to calculating the price to earnings ratio, an essential means of determining whether a company's share price accurately reflects its profitability.
The basic version features only the company's weighted average common shares outstanding. The diluted calculation involves all possible shares that the company could issue through convertible instruments. Diluted EPS will always be equal to or lower than basic EPS, another more conservative measurement of the same value. This gap between two metrics is important for HR to note, showing just how much equity-based awards impact earnings.
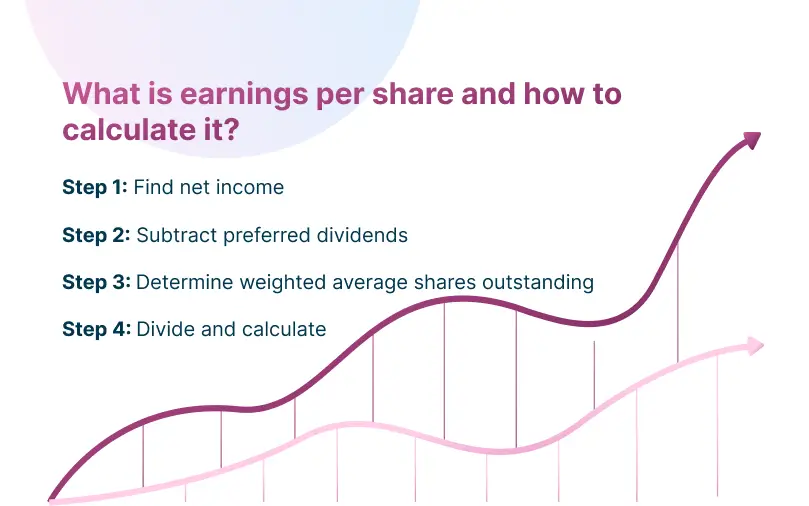
The most common way to calculate earnings per share is as follows:
Formula: EPS = (Net Income - Preferred Dividends) ÷ Weighted Average Common Shares Outstanding
Locate the company's net income (its total profit after taxes and expenses) on the income statement.
Preferred shareholders come before common shareholders in profit distributions. This value is 0 for companies without preferred stock issuance.
Formula: Net Income - Preferred Dividends
A company's total shares change throughout the year due to new issuances or stock buybacks. To ensure accuracy, multiply the number of shares outstanding for each period by the fraction of the year they were in circulation and add them together.
Formula: Weighted Average Shares Outstanding
Divide the earnings available to common shareholders (Step 2) by the weighted average number of shares outstanding (Step 3).
While earnings per share measures profitability on a per-share basis, HR and compensation professionals must also understand how company performance compares with the broader market.
CompAnalyst® Market Data provides access to extensive compensation and labor market data, enabling organizations to make informed reward decisions alongside key financial metrics such as earnings per share.
Example Calculation
Imagine a company has:
Net Income: $10,000,000
Preferred Dividends: $500,000
Weighted Average Common Shares: 4,500,000
Adjust Earnings: $10,000,000 - $500,000 = $9,500,000
Divide by Shares: $9,500,000 ÷ 4,500,000 = $2.11
Your resulting EPS is $2.11 per share.
EPS is perhaps the most common financial measure used to determine executive bonuses and long term incentives. Should EPS exceed targets, higher payouts are made. Should company EPS take a decline, such bonuses may shrink entirely within the awarded level.
A higher EPS indicates better profitability and thus larger bonus pools available
Growth in EPS boosts sentiment among investors and the company's share price
Comparing EPS to analyst predictions can dictate stock price and equity value movements
Such figures can be distorted by non recurring events, hence the use of adjusted EPS figures
Organizations that tie executive bonuses and incentive compensation to earnings per share performance can use CompXL® to automate bonus planning, model payout scenarios, manage compensation budgets, and administer incentive programs. This helps HR teams align compensation outcomes with company financial performance while maintaining consistency and transparency across the organization.
The most common adjusted figures remove one time charges, restructuring costs and stock based compensation expenses. Such an adjustment ensures that unusual events do not impact executives' pay evaluations.
Most companies use approved budgets from the board, historical EPS and analyst estimates to determine targets. The HR incentive committees establish ranges for threshold, target and maximum payouts. Companies within the same industry benchmark themselves against industry peers for competitive advantage.
Every stock option or restricted stock unit that a company grants impacts its diluted EPS. Thus, HR teams in charge of managing such programs must understand this area as the company's finance teams pay close attention to such figures.
| Equity award type | Impact on EPS |
|---|---|
| Stock options | Increase in diluted shares if these are in the money, lowering the company's diluted EPS |
| Restricted stock units | Added to the share count for diluted exposure from the grant date, reducing EPS |
| Convertible debt | If this debt is converted, it will increase shares outstanding and diluted EPS |
| Stock buybacks | Decrease shares outstanding, inflating EPS despite unchanged net income |
As organizations balance equity compensation with shareholder value, CompAnalyst® helps HR teams benchmark compensation programs, evaluate total rewards strategies, and make informed pay decisions using market-based compensation data and analytics. This enables HR professionals to better understand how equity awards fit within the organization's broader compensation strategy.
These types of equity grants contribute to the consideration of potentially dilutive shares within the fully diluted EPS calculation. Thus, diluted EPS falls as the denominator increases. For companies featuring extensive stock compensation programs, such a gap between basic and diluted EPS reflects potential dilution of shareholder returns.
Restatements typically follow erroneous reporting of earnings statements. For HR teams, this means a potential clawback of compensation.
Correcting EPS may require recalculating bonuses for previous fiscal years
Both material and immaterial restatements trigger clawback requirements
Companies must reveal details of restatements and recovery efforts in public filings
Any such restatement damages the company's financial health and confidence of investors
A 2026 analysis of SEC Rule 10D-1 found that 114 companies had flagged errors to be corrected within Q1 2026, a drop from the 142 that did so within the same quarter of 2025. Disclosure practices remain uneven.
Under SEC Rule 10D-1, companies must recover excess compensation from executives if earnings are restated to show previously overstated figures. The policy applies to pay received within any three fiscal years before the restatement, regardless of any fault.
Here are the frequent questions about the earnings per share:
There is no universal number that represents a good EPS. Industry and market factors play a role. A steady increase indicates long term stability. The best comparisons occur of companies within the same sector.
EPS is most valuable when compared with share price, the P/E ratio. Higher EPS generally means increased stock prices. A lower EPS does not indicate a necessarily poor investment opportunity. Future growth and earnings yield are also examined by investors.
No. EPS breaks net income by shares outstanding to reveal profit per share. The figure is useful to compare profitability between companies regardless of size.
A higher value indicates better profitability and value for common shareholders. However, higher than expected EPS may result from stock buybacks. HR teams should also consider cash flow and trailing EPS levels as well as the company's performance abilities. Declining EPS suggests potential lower stock prices reflecting lost investor confidence.

The latest research, expert advice, and compensation best practices all in one place.
Blog
Bringing trusted compensation intelligence and seamless planning to even more ADP users.

Blog
Learn how to train managers for effective pay conversations and build trust.

Blog
Total rewards package flexibility lets employees choose what matters - pay, perks, and benefits tailored to their needs.