
Not sure which plan fits your team?
Talk to a compensation data specialist - get a personalized walkthrough in 15 minutes.
CompAnalyst market composite & salary structure
CompAnalyst Market Composite gives compensation teams the largest HR-reported dataset in the industry — 10+ billion data points, 20,000+ job titles, 225 industries — so every salary decision is backed by defensible, audit-ready market data.

Market Composite and Salary Structures is a salary structure software tool that helps compensation teams build market-based pay ranges using verified HR data. It combines Salary.com market data with third-party salary surveys to create market composites for hybrid or hard-to-match roles. The platform is built on more than 10 billion HR-reported data points across 20,000+ job titles and 225 industries, giving employers a large base for salary benchmarking software workflows. Users can scope data by industry, company size, and geography, including zip code level, then model grade midpoints, spreads, and overlaps in a drag-and-drop interface. It also estimates cost-to-correct when employee pay falls below range minimums. In practice, the product supports pay range management by helping companies create defensible salary structures, answer compensation "what-if" questions quickly, and document ranges for pay transparency and internal governance.
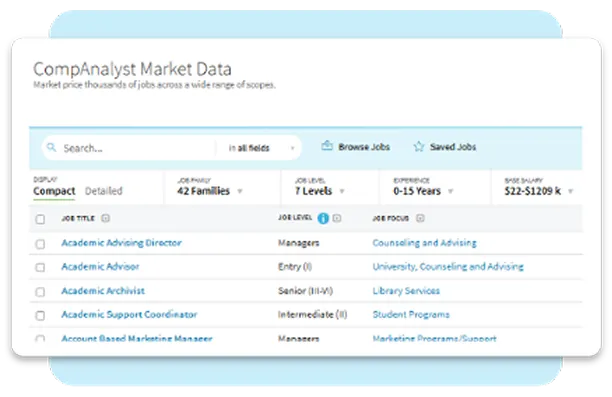
Access the gold-standard database of 20,000+ unique job titles. Scope data by industry, company size, and granular geographic location (down to the zip code) to ensure your offers are competitive against the actual companies you compete with for talent.
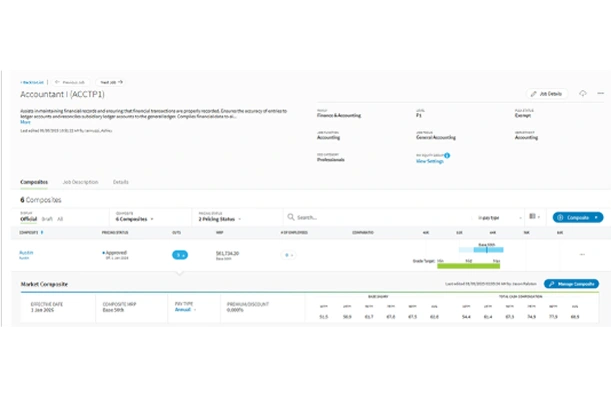
Create market composites by blending data from Salary.com and your third-party salary surveys. Perfect for pricing hybrid roles, like a Marketing Manager who also handles Sales Ops.
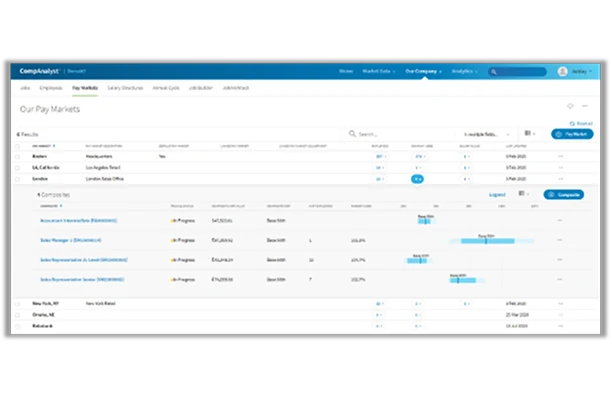
Gain fast, customizable compensation insights by defining clear pay markets that streamline market pricing and align jobs, employees, and salary structures.
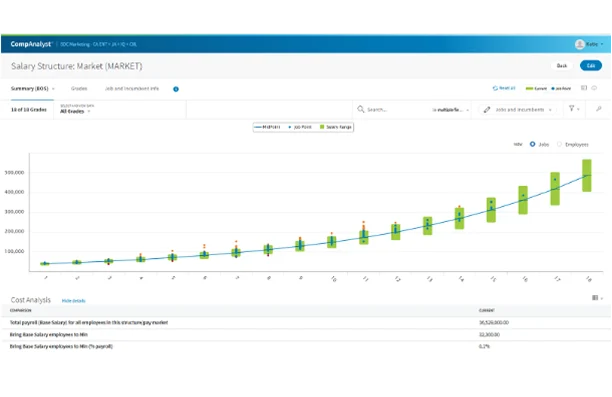
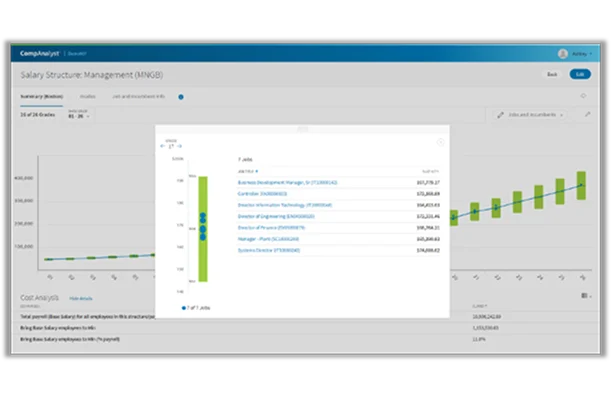
Build a new salary structure in just 3 clicks. The modeling wizard analyzes your market data and automatically suggests grade midpoints, spreads, and overlaps. Drag-and-drop jobs into grades and instantly see the “Cost to Bring to Minimum” for every employee.
Answer “What if?” questions instantly. Model a 3% structure adjustment or a minimum wage increase and see the financial impact on your budget immediately. Visual heatmaps identify employees who are paid below-market (flight risks) or above-market (outliers).

| Role | How CompAnalyst Helps |
|---|---|
| Compensation manager | Cut market pricing time from days to minutes; build audit-ready salary structures |
| HR director / VP of HR | Present defensible pay data to leadership; reduce pay-equity risk |
| CFO / Finance | See real-time cost impact of pay decisions before they’re finalized |
| CHRO / CPO | Align compensation strategy with talent retention and transparency mandates |
| Feature Category | CompAnalyst | Competitive Tools | HRIS Vendor Modules |
|---|---|---|---|
| Market Data Foundation | 100% HR-reported dataset with 10+ billion market data points. Highly defensible and audit-ready. | Frequently relies on crowdsourced or non-validated data; less defensible for formal audits. | Data is often static and outdated; lacks industry-specific peer segmentation. |
| Market Composites | AI-driven matching and automated scoping across 20,000+ job titles. Supports bulk pricing of entire job families. | Smaller datasets can lead to inaccurate matches for niche roles; often requires more manual “leg-work”. | Lacks purpose-built tools for mapping third-party surveys; mapping is often functionally unusable for deep analysis. |
| Salary Structure Modeling | Create a structure in 3 clicks. Drag-and-drop editor to instantly visualize outliers and cost-to-correct. | Can be administratively manual for complex regional bands or global nuances. | Salary bands are static; they do not automatically adjust to market shifts or allow complex scenario modeling. |
| Strategic Scenario Modeling | Real-time impact modeling for merit increases, bonus pools, and budget adjustments. | May lack the enterprise depth required for multi-year budget forecasting across massive workforces. | Usually absent; unable to model the financial impact of pay decisions before they are finalized. |
| Workflow & Integration | Direct, pre-built APIs for major HRIS (e.g., Workday, UKG, BambooHR). “System of action” design. | Can be significantly more expensive (reportedly up to 3X) while requiring more manual data exports. | Built as a “system of record”; lacks the specialized logic needed for complex merit cycles and equity audits. |
A market composite blends data from multiple salary surveys into a single, weighted market rate for a specific job. It gives you a more accurate and defensible benchmark than relying on any single survey source.
CompAnalyst draws from over 10 billion HR-reported data points across 20,000+ job titles and 225 industries, updated monthly.
Yes. You can blend Salary.com data with any third-party survey data to create custom market composites.
The wizard analyzes your market data, suggests grade midpoints and spreads, and lets you drag-and-drop jobs into grades. You can build a complete salary structure in 3 clicks.
Yes. It generates defensible salary ranges for every role and flags outlier employees so you can address pay gaps before posting ranges publicly.
CompAnalyst has pre-built API integrations with Workday, UKG, BambooHR, and other major HRIS platforms.
For over 25 years, Salary.com has been the leader in compensation technology. Our data is consistently recognized by G2 as the top choice for Enterprise, Mid-Market, and Small Business compensation management.
Transform compensation at your organization and get pay right — see how with a personalized demo.

