Blog
Get Pay Right on ADP Workforce Now® Next Gen™
Bringing trusted compensation intelligence and seamless planning to even more ADP users.
Written by Salary.com Staff
May 23, 2025

Calculating and tracking revenue per employee (RPE) is important for analyzing a company's financial well-being. This employee metric offers valuable insight into how effectively a company leverages its human capital to generate revenue.
A recent study shows that a tech company makes $2.4 million in this, driven by its product ecosystem and operational efficiency, highlighting its financial dominance and capacity to optimize profit margins and average employees' revenue.
This guide will explore the employee ratio, the impact of employee turnover, how much revenue each employee contributes, and a step-by-step method for calculating the RPE.
Revenue per employee refers to the income generated by each employee within a company. A good ratio indicates that the company is efficiently utilizing its workforce to produce significant revenue.
To calculate, apply the following formula: Revenue per Employee = total revenue ÷ number of employees
Where: Total revenue = the company's annual revenue (or revenue from a specific period) Number of employees = full-time employees (FTEs)
For example, if a business reports $4 million in annual revenue and has 40 full-time employees, its RPE would be: $4,000,000 / 40 = $100,000. On average, each employee generates $100,000 in income for the company. That’s a strong revenue figure, though whether it's good or not depends on benchmarks within the same industry.
Evaluating revenue per employee with industry standards helps companies assess their labor costs and efficiency. HR analytics and benchmarking enable businesses to align labor costs with this by comparing compensation and employee ratios to industry standards.
HR leaders should care about revenue per employee as it links human capital to the company’s financial health.
Research shows that companies prioritizing employee engagement see three times more revenue, 40% lower turnover, and 15% higher productivity, emphasizing HR's role in business success.
Tracking RPE helps align workforce strategy with revenue goals, improve productivity, and manage labor costs.
It also provides insights into employee turnover, engagement, and retention, while enabling benchmarking against competitors to drive greater revenue and support long-term growth.
Sales and marketing, employee productivity, and industry type all affect the RPE ratio. High labor costs, employee turnover, and inefficient workforce structure can reduce RPE.
Fewer employees, economic conditions and industry trends also play a role in determining how much revenue each employee generates, impacting the company's profit margins and long-term growth.
Recognizing these aspects allows companies to develop strategies for productivity and financial performance, Workforce planning helps assess how effectively employees drive tracking RPE, allowing HR teams to analyze turnover, efficiency, and workforce ratios to align human capital with business goals.
Here are the steps on how to calculate revenue per employee:
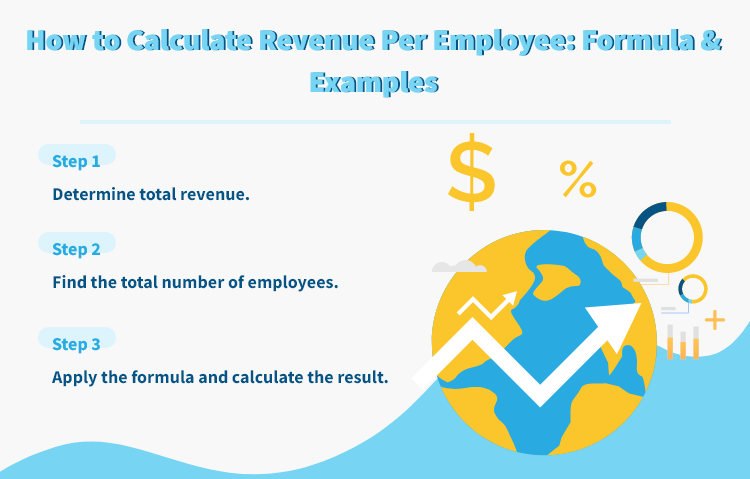
Identify the total revenue of the company for a specific timeframe, typically based on annual revenue. This financial data is usually available in the business’s revenue report or income statement.
Determine the current number of full-time employees and part-time staff members working for the company during the same period. This employee calculation is typically found in HR records or the company’s annual reports, reflecting its overall workforce size.
Total revenue per employee = total revenue ÷ number of employees
Calculate by dividing total revenue by the current number of employees.
Calculating RPE offers significant insight into how efficiently a company is utilizing its personnel to generate revenue. A higher RPE often signals higher revenue and better productivity, while a lower RPE may point to inefficiencies or the need for more strategic workforce planning.
This employee metric is especially useful when comparing revenue across organizations in the same industry or assessing a company’s financial health and profit margins over time.
Here are a few examples of RPE to help illustrate how the metric varies by industry and company:
Annual revenue: $12,000,000
Employees: 40
RPE calculation: $12,000,000 / 40 = $300,000
RPE: $300,000
ABC Technologies, with an RPE of $300,000, showcases higher revenue efficiency in leveraging its workforce, a common trait among software companies in the same industry that offer high-margin products.
Annual revenue: $9,000,000
Employees: 100
RPE calculation: $9,000,000 / 100 = $90,000
RPE: $90,000
XYZ Retail Group, with an RPE of $90,000, reflects the labor costs and employee ratio typical of the retail sector, where the business model tends to have lower profit margins and requires more staff members to generate revenue.
Annual revenue: $25,000,000
Employees: 150
RPE calculation: $25,000,000 / 150 = $166,667
RPE: $166,667
CDN Contractors Inc, with an RPE of $166,667, demonstrates a strong balance between labor costs and the high-value projects that are typical in the construction industry, highlighting the efficient use of human capital to drive higher revenue.
Monitoring RPE is important for assessing employee productivity, managing labor costs, and comparing performance across competitors, ensuring alignment with business goals and financial health for long-term growth.

The latest research, expert advice, and compensation best practices all in one place.
Blog
Bringing trusted compensation intelligence and seamless planning to even more ADP users.

Blog
Learn how to train managers for effective pay conversations and build trust.

Blog
Total rewards package flexibility lets employees choose what matters - pay, perks, and benefits tailored to their needs.