Graph Code Salary

How much does the Graph Code Pay for employees?

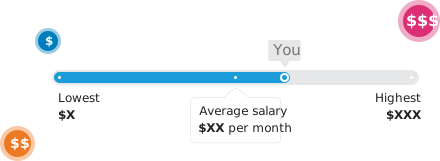
As of July 2026, the average monthly salary for employees at Graph Code in the United States is $7,188. This translates to an approximate annual wage of $86,251. Salaries at Graph Code typically range from $6,317 to $8,132 monthly, reflecting the diverse roles and experience levels within the company. Graph Code’s salaries are influenced by a wide range of factors including job role, department, years of experience, and location.
DISCLAIMER: The salary range presented here is an estimation that has been derived from our proprietary algorithm. It should be noted that this range does not originate from the company's factual payroll records or survey data.

How Much Does Graph Code Pay for Different Roles?

Explore detailed salary information for specific jobs at Graph Code. The table below outlines the annual salary ranges for popular roles within the company, helping you benchmark potential earnings. Use 'View by Card/Table' option to find the data most relevant to your career path.
DISCLAIMER: The salary range presented here is an estimation that has been derived from our proprietary algorithm. It should be noted that this range does not originate from the company's factual payroll records or survey data.
How accurate does the salary look to you?

Current Job Openings at Graph Code

Ready for your next career move? Explore current job openings at Graph Code. Use the search tool below to find available positions by title and location and apply directly to start your career.

Is Graph Code’s Pay Competitive? Salary Benchmarking Analysis

How does Graph Code’s compensation stack up against the market? This analysis visualizes their annual average salary compared to its industry benchmark and key peer companies.
Peer Company & Industry Benchmarking
180k
150k
120k
90k
60k
30k
0
Average Salary ($/year)
Graph Code
Business Services
NK Studio
Boundary
Industry Comparison
Our data shows that, on average, compensation at Graph Code is below the average for the U.S. Business Services industry by approximately 29%. This positioning suggests their pay is below the market average within their sector.
Peer Company Comparison
To provide a broader market perspective, we compared Graph Code average annual salary with several similar companies. Graph Code average salary of $86,251 is lower than NK Studio, which has an average salary of $103,022. It is lower than Boundary, with their average salary at $100,491. This places Graph Code in a developing position among its peers.
See Your True Competitors
The companies behind the question marks could be hiring your best people. Don't operate with incomplete data. Unlock your full competitive view with Salary.com for Business to precisely benchmark salaries, benefits, and more against your true competitors.

Employee Reviews: Working at Graph Code

Considering a career at Graph Code? Explore authentic employee reviews to learn about the work environment, career growth opportunities, pay transparency and benefits. These first-hand insights can help you set realistic compensation expectations and make informed career decisions.
Everyone’s voice is heard. This company’s values align with mine, particularly regarding ethical practices and social responsibility. The company’s commitment to diversity and inclusion is genuine. My manager is a fantastic advocate for me and my team.
The company actively encourages community involvement and corporate social responsibility. However, the culture is reserved. A dynamic workplace with clear values and genuine people. While that structure suits some, others might find it isolating. Policies are strict but fair. I’ve grown so much here and look forward to what’s next. Working here is relatively predictable, with a strong emphasis on...
The open communication channels make this possible and effective for our team. While not every process is perfect, overall the experience is satisfying and offers meaningful work. A suitable place for professionals seeking stability over fast change or innovation. This company promotes a high-performance culture without compromising employee well-being. The ethical standards and integrity of this ...

Graph Code Overview

Website
www.graph-code.com
Founded In
2010
Employees
<25 employees
Industry
Business Services
Headquarter Address
11740 SW 80th St Miami Florida FL 33183
Revenue
<$5 Million
Phone Number
+1 7865922781
Social Media
About Graph Code
We are a digital solutions company that specializes in creating effective strategies that help your business accomplish its goals. Web & Graphic Design.

What Benefits Does Graph Code Offer Beyond Salary?

A competitive compensation package is more than just a salary. Graph Code offers a comprehensive benefits package designed to support your health, financial future, and overall well-being. Below are the most common key benefits:
Social Security
401(K)
Disability
Healthcare
Pension
Time Off (days)
Work at Graph Code?
Share your experience
How Much Should You Be Earning?

Get an estimated calculation of how much you should be earning and insight into your career options.

illustration

What Is the Cost of Living Near Miami?

Understanding the cost of living near Miami is key to truly evaluating a salary offer or your current compensation at Graph Code.
Miami's Cost of Living Index is approximately 117.5 (17.5% more expensive than US average; 14.0% more than FL average). Major international city, very high housing costs, vibrant culture, significant traffic. Metrorail/Metromover/Bus. When planning your budget based on a salary from Graph Code, consider these typical monthly expenses:
Expense Category Estimated Monthly Cost Key Considerations / Notes
Housing (1-BR Apt Rent) $1,800 - $2,800+ A significant portion of Graph Code salary. Location choices impact this heavily.
Utilities (Basic) $160 - $270 Electricity, Heating, Cooling, Water etc.
Public Transportation $112.50 (Miami-Dade EASY Ticket monthly) Essential for most commuters; car ownership is costly.
Groceries (Single Person) $440 - $660 Can be higher with more dining out or specialty stores.
Personal & Leisure $450 - $850+ Dining out, entertainment, shopping. Highly variable.
Healthcare (Individual) $400 - $750+ Varies significantly by plan & employer contribution.
Subtotal (Excluding Taxes) $3,262 - $5,332+ This subtotal does not include income taxes (federal, state, local), which can significantly impact your take-home pay.

FAQs of Graph Code

1. What is the average salary for employees at Graph Code?

The average annual total compensation for employees at Graph Code is approximately $86,251. However, this is an aggregate figure, actual salaries can range significantly, typically from $75,810 to $97,588, depending on factors like job role, experience, and location.

2. How much does Graph Code pay compared to NK Studio?

The average annual salary at Graph Code is $86,251, or an hourly wage of $41, in comparison to NK Studio which pays $103,022 per year or $50 per hour.

3. How does having a professional certification impact salary for relevant roles at Graph Code?

Professional certifications like PMP (for Project Managers), CPA (for Accountants), or another relevant certification for the industry can often lead to higher salaries and better job prospects at Graph Code for applicable roles. Certifications demonstrate a verified level of expertise and commitment to a profession, making candidates more competitive.

4. Does Graph Code offer cost-of-living adjustments (COLA) for employees in high-cost areas like Miami?

While some companies offer formal COLA, many, including potentially Graph Code, incorporate cost of living considerations into their overall salary structure for different locations rather than as a separate, itemized adjustment. This means their base pay bands for roles in high-cost cities like New York City are generally set higher to account for these local market factors.

5. What's the typical process for salary reviews and raises at Graph Code?

Most companies, likely including Graph Code, conduct formal salary reviews annually, often tied to performance evaluations. During these reviews, factors like individual performance, meeting goals, company performance, and market adjustments are typically considered for potential salary increases.