Grinding and Polishing Worker, Hand Salary in the United States
Grinding and Polishing Worker, Hand Salary
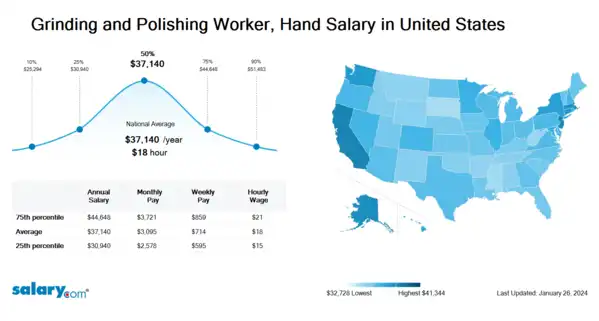
How much does a Grinding and Polishing Worker, Hand make in the United States? The average Grinding and Polishing Worker, Hand salary in the United States is $37,274 as of March 26, 2024, but the range typically falls between $31,051 and $44,809. Salary ranges can vary widely depending on many important factors, including education, certifications, additional skills, the number of years you have spent in your profession. With more online, real-time compensation data than any other website, Salary.com helps you determine your exact pay target.
| Percentile | Salary | Location | Last Updated |
| 10th Percentile Grinding and Polishing Worker, Hand Salary | $25,385 | US | March 26, 2024 |
| 25th Percentile Grinding and Polishing Worker, Hand Salary | $31,051 | US | March 26, 2024 |
| 50th Percentile Grinding and Polishing Worker, Hand Salary | $37,274 | US | March 26, 2024 |
| 75th Percentile Grinding and Polishing Worker, Hand Salary | $44,809 | US | March 26, 2024 |
| 90th Percentile Grinding and Polishing Worker, Hand Salary | $51,669 | US | March 26, 2024 |
Rope Access, Industrial Insulation Technicians - Projects/Multiple Locations
IRISNDT Inc - Canton, OH
Enprotech, LLC - Cincinnati, OH
General Tool Co - Cincinnati, OH
Concrete Craft of Cleveland - Columbia Station, OH
- View Hourly Wages
-
Select State
-
Select City
-
Choose Similar Job
-
Pick Related Category
- View Cost of Living in Major Cities
Job Description for Grinding and Polishing Worker, Hand
Grinding and Polishing Worker, Hand sets-up and operates automatic machines that cut, grind, or polish glass products such as glass tubes or glassware. Requires a high school diploma or its equivalent. Being a Grinding and Polishing Worker, Hand may have to complete an apprenticeship and/or formal training in area of specialty with 2-4 years of experience in the field or in a related area. Familiar with standard concepts, practices, and procedures within a particular field. Additionally, Grinding and Polishing Worker, Hand relies on limited experience and judgment to plan and accomplish goals. Performs a variety of tasks. Works under general supervision. A certain degree of creativity and latitude is required. Typically reports to a supervisor/manager. (Copyright 2024 Salary.com)... View full job description
See user submitted job responsibilities for Grinding and Polishing Worker, Hand.
Search Job Openings
Salary.com job board provides millions of Grinding and Polishing Worker, Hand information for you to search for. Click on search button below to see Grinding and Polishing Worker, Hand job openings or enter a new job title here.
What does a Grinding and Polishing Worker, Hand do?
Are you an HR manager or compensation specialist?
Salary.com's CompAnalyst platform offers:
- Detailed skills and competency reports for specific positions
- Job and employee pricing reports
- Compensation data tools, salary structures, surveys and benchmarks.

Grinding and Polishing Worker, Hand Pay Difference by Location
Grinding and Polishing Worker, Hand salary varies from city to city. Compared with national average salary of Grinding and Polishing Worker, Hand, the highest Grinding and Polishing Worker, Hand salary is in San Francisco, CA, where the Grinding and Polishing Worker, Hand salary is 25.0% above. The lowest Grinding and Polishing Worker, Hand salary is in Miami, FL, where the Grinding and Polishing Worker, Hand salary is 3.5% lower than national average salary.
| City, State | Compared to national average |
|---|---|
| City, State San Francisco, CA |
Compared to national average
|
| City, State Washington, DC |
Compared to national average
|
| City, State Miami, FL |
Compared to national average
|
| City, State Chicago, IL |
Compared to national average
|
| City, State Boston, MA |
Compared to national average
|
| City, State New York, NY |
Compared to national average
|
| City, State Dallas, TX |
Compared to national average
|
Level of Education for Grinding and Polishing Worker, Hand
Jobs with different levels of education may pay very differently. Check the Grinding and Polishing Worker, Hand salary of your education level.
- Grinding and Polishing Worker, Hand Salaries with No Diploma
- Grinding and Polishing Worker, Hand Salaries with a High School Diploma or Technical Certificate
- Grinding and Polishing Worker, Hand Salaries with an Associate's Degree
- Grinding and Polishing Worker, Hand Salaries with a Bachelor's Degree
- Grinding and Polishing Worker, Hand Salaries with a Master's Degree or MBA
- Grinding and Polishing Worker, Hand Salaries with a JD, MD, PhD or Equivalent
Grinding and Polishing Worker, Hand Salary by State
Geographic variations impact Grinding and Polishing Worker, Hand salary levels, due to various factors, such as cost of living, industries, market demand and company budgets. Click below to see pay differences between states.
Browse All Skilled and Trades Jobs by Salary Level
Browse Related Job Categories With Grinding and Polishing Worker, Hand
A job category is a classification or grouping of job positions that share similar characteristics, functions, or industries. Grinding and Polishing Worker, Hand salary varies from category to category. Click below to see Grinding and Polishing Worker, Hand salary in different categories.
Take just three simple steps below to generate your own personalized salary report
Understand the total compensation opportunity for a Grinding and Polishing Worker, Hand, base salary plus other pay elements
Average Base Salary
Core compensation
Average Total Cash Compensation
Includes base and annual incentives
View the Cost of Living in Major Cities
Recently searched related titles: Representative Payee, Airport Operations Agent, Creative Services Specialist
Salary estimation for Grinding and Polishing Worker, Hand at companies like : Phoenix Bee Removal LLC, Bennett - Health & Wealth, American Board of Urology
Jobs with a similar salary range to Grinding and Polishing Worker, Hand : Summer Intern, Legal Proofreader, Assistant Grower
